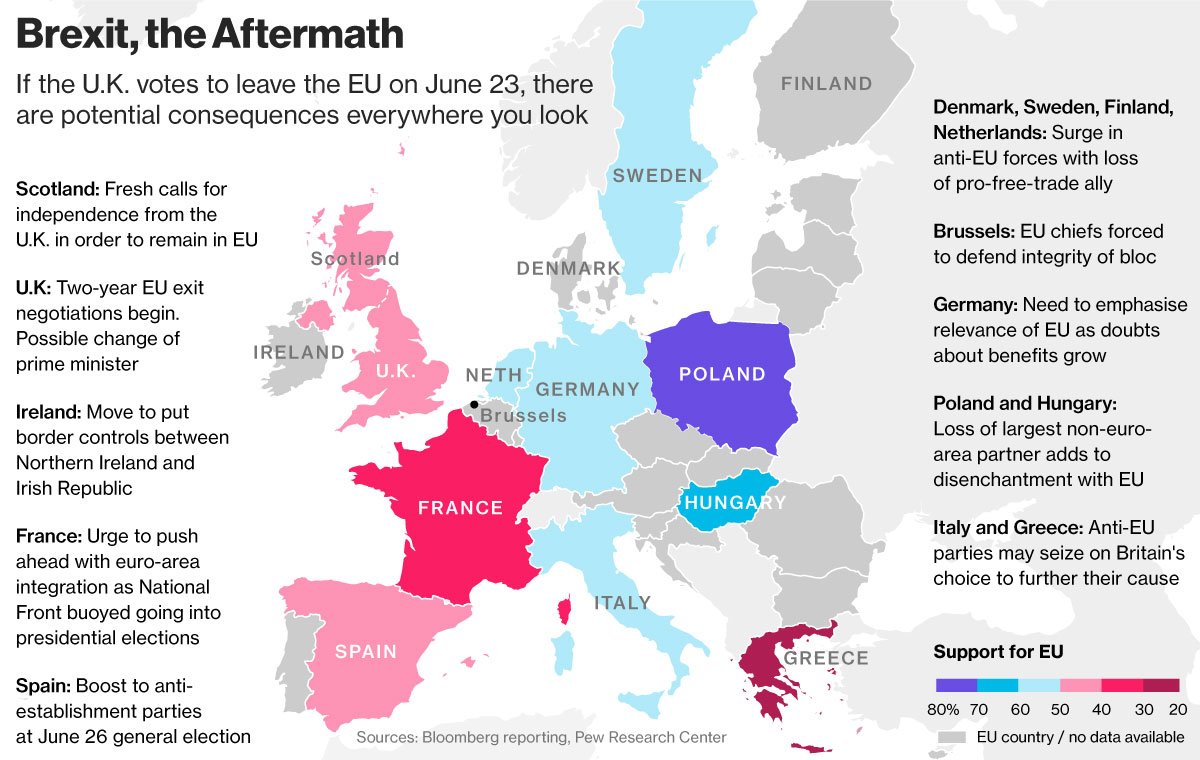
This article will demonstrate a few of the ways the adaptive CCI can be used to trade. There are many chat rooms and web sites that deal with this one indicator. Most are derivative of the one main room that promotes using this single indicator. While this main room claims to have discovered certain pattern using the CCI, most of these patterns have been talked about for many years by other technical analysts, perhaps not using the CCI, but using another indicators triggering similar signals. Therefore, there is much information available to study regarding patterns on indicators.
If you’ve read the two preceding articles on the CCI you will understand the basic structure of the indicator and the need to have the proper input parameter. When I began using this indicator, mostly for trading intraday charts, I felt the main chat rooms were way off base in their understanding of this indicator for all the reason I described in the first two articles. My first attempt at improving the indicator was to plot several different parameters, such as 21 period, 34 period, 89 period, etc. I stuck with fibonacci numbers just to keep the choices manageable, not because I believed there was any special power to these numbers. I thought I could spot the cycle and its corresponding parameter and just trade that particular version. There is something to be said about keeping the parameter consistent. But after much testing I found I was more trusting of an adaptive technique where I only had to watch one CCI and let the computer estimate which cycle length was dominant. Another thing became clear, and that is: one indicator can’t do everything. But too many indicators will cause confusion. There’s a balance of what you can watch and react to. If you are a daytrader you need fewer indicators because you don’t have time to over analyse. The trade will pass you by. If you are a position trader you have more time, but still too many indicators can cause analysis paralysis. And, you can always find some indicator that will give you the answer you want based on your bias.
For now, I will focus on this one indicator, although I don’t trade with just what I’m going to present on these charts. Since this is an article on application of the CCI it would be confusing to show other indicators and then try to explain their useage at the same time. I will have an article in the future that puts all the elements together. But the following patterns are the basis of what I look for when I analyse a market using the CCI. There is much more to consider before a trade can be put on, such as overall trend direction, trend strength, etc. So please don’t use these examples out of context. They do not represent a complete trading approach.
The CCI that I use on a daily basis is a combination of the adaptive CCI along with smoothed version of the CCI, as described in the previous article. This is done to help smooth out the bumps so I can get a better picture of the pattern that is setting up. The adaptive CCI does filter out much of the noise, but the smoothed version filters out even more, with very minimal lag. I plot the smoothed version as a thick black line along with the histogram bars that change color depending on the trend. I usually plot the unsmoothed adaptive CCI as a thin blue line, although in some of these examples the unsmoothed line will be thicker yellow line to make it easier to see on the smaller charts.
When Lambert created the CCI his idea was to trade excursions outside the one hundred lines. In actual testing in the early days, back in the early 80′s when the PC and trading software started appearing, the results of doing this were so bad that most technicians reversed the rules and started trading crosses back into the hundred lines. If only 20% of the prices would go beyond the hundred lines, it made sense to trade when the CCI crossed back inside where 80% of the prices were to occur. Of course they were using a static parameter in those days. If they could have extended the parameter as the cyclic component started to abate as it does when a trend appears, Lambert’s original idea may have gained more of a following.

The chart above is the smoothed adaptive CCI along with the thin blue line, which is the basic, unsmoothed adaptive CCI. The point of showing this chart is to demonstrate how, with the correct cycle and input parameter, the market will stay in a trend mode as long as the CCI is beyond the 100 line, as perscribed by Lambert. It didn’t catch every tick out of the trend, but it did do a very good job. All divergences should be ignored as long as the CCI is over the +100 line in an uptrend, or below the –100 line in a downtrend. In this example I’m sure there are many other methods, such as a simple moving average, that would have also kept you in this trend. In this case prices stayed over about one and a quarter standard deviations above the moving average that represented the cycle in play (meaning the 100 line represents about 1 ¼ SD).

In this chart I changed the raw adaptive CCI color to yellow and made it thicker for clarity. The pattern inside the pink ellipse is a micro M pattern. I don’t trade these types of momentum reversals if they are against the main trend, which I determine with other indicators. But for this example I’ll assume that I did want to go short this market. If I just relyed on the basic adaptive CCI I may have gone short on the first downturn, or the left side of the M. I find it dangerous to go short on the unsmoothed CCI momentum reversal if the smoothed CCI is still trending up. On the second reversal, the right side of the M, the smoothed CCI turned down resulting in a much safer entry point.
Here is another example but in the other direction. This would be a micro W on the unsmoothed adaptive CCI. When it finally turned up again on the right side, the smoothed version turned up as well, resulting in a much better and safer trade.

Perhaps the best and safest trade is the first pullback. I first learned of this concept from Linda Raschke. She favored trading the first pullback after a trend appeared. She offers a few variations. Her grail trade is a pullback to a moving average. She trades bull flags with various triggers such as by using her 310 oscillator. This CCI trade is essentially the same type of trade. When the CCI bars, as defined by the smoothed adaptive CCI, have been on one side of the zero line and then the CCI goes to the other side of the zero line, one can enter on the first pullback to the zero line as momentum shifts back in the direction of the trade. In this example the bars turned green, then pulled back to the zero line, and then on the first CCI uptick a long trade can be entered. I use the smoothed line as the signal, but prefer to have the unsmoothed CCI line lead the way up. In this example they both turned on the same bar. In some cases the unsmoothed line will turn first, and the following bar will show the smoothed line turning. The zero line reject is somewhat different, as that will require, from the basic rules using a 14 period CCI, a high level of the CCI, usually over the 100 line, preceeding the pullback to the zero line. With the static 14 or 20 CCI you get many of these, and most result in losses. With the adaptive CCI it is common to have this setup, but without the need for the CCI to first have been at a high level. There are many continuation trades that do have the adaptive CCI coming from a high level, put in the case of the first pullback it is not required.

Here is an example of a zero line reject that does have the adaptive CCI starting the descent to the zero line from a high level, in this case from between the 100 and 200 lines.
The next pattern is simply three drives to a bottom. Sometimes it’s three drives to a top. The best patterns seem to occur when the three CCI lows create a divergence with price. In the case of a bottom, three lower lows on price and three ascenending, or higher lows on the CCI. Sometimes the divergence is create with the first and third low and the middle low falling somewhere in between. In some chat room this concept is only traded when the second low is the lowest of the three, which would be a head and shoulder pattern. I find those to be less reliable in general. When I do see them I prefer to also use the detrended CCI as confirmation. Examples of this will follow.

Here is an example of three drives to a top. Here I have the unsmoothed and smoothed adaptive CCI. The CCI is like a flat head and shoulders, while there are three very distinct impulses up. On the right side on the price bars, where I drew the horizontal blue line, you can see a slight attempt for the market to push back up, but the CCI was already heading to new recent lows. When the kink in the raw link turned back down in the direction of the smoothed line, the market made a nice move to the downside. Not all of these reversal trades work this nicely. Reversal patterns are the most unreliable and difficult to trade. It is always easier and safer to trade in the direction of the trend.

The next pattern is the hook around the zero line. It has a different name in various chat rooms. I find it to be an excellent pattern. In this example the unsmoothed adaptive CCI is making the hook while the more stable smoothed adaptive CCI is trending in one direction. If find these especially powerful. Sometimes the smoothed adaptive CCI will be dominant in making the hook.
Here is an example of the micro M top from near the extreme 200 line (the left ellipse). If one missed this entry, or passed on it because the trend was still up, the next chance to get in on the downside was a slight hook of the unsmoothed CCI near the zero line. I didn’t highlight this as it was quite subtle. The more realistic trade was the first pullback, in this case a pullback up toward the zero line, which is highlighted with the ellipse on the right side of the chart.

Here is a micro M and a zero line reject combination. There was also a kink in the unsmoothed adaptive CCI against the declining smoothed adaptive CCI. I don’t often take these, but when I see them they can influence a continuation of a trade, or sometimes be part of another pattern. It is marked with the red down arrow. If I had taken the zero line reject and prices failed to move in the anticipated direction within a few bars, I might be tempted to exit the trade. However, when I see this kink in the unsmoothed CCI in the direction of the smoothed CCI, I will assume that the momentum will continue in my direction and that prices should follow. Sometimes there is a series of these zig zagging kinks against, and then with, the direction of the smoothed line. That probably signifies a choppy environment so I will go with the flow, but will keep my finger close to the mouse button.

Here another example of the micro W, probably with divergence (but don’t have prices up to be sure) and a hook around the 100 line, as denoted by the first up arrow. The second up arrow is another kink of the unsmoothed CCI in the direction of the smoothed CCI.
Here are many of the previously discussed patterns. The left ellipse is a micro M, followed by a hook of the raw CCI around the zero line in the direction of the smoothed CCI (first red down arrow). Following is a near perfect zero line reject that triggered via the unsmoothed and smoothed CCI on the same bar (second red down arrow). Finally there is a micro W with divergence (the rightmost ellipse).

Here’s a chart of the smoothed only version of the adaptive CCI with prices. There was an up zero line reject to the left when the histogram was green. But more important was the first pullback after the trend had evidence of being down, as the histogram turned red. This is my favorite trade. Notice how prices made a halfway attempt at a rally before giving up and falling. The smoothed adaptive CCI caught the move nearly perfect. The following examples will display only the smoothed version of the adaptive CCI for clarity. I usually have the unsmoothed version on my charts, but it is displayed only as a faint blue line. Sometimes I prefer the simplicity of only having the smoothed version in my charts.
Here is another example of a first pullback after the trend turned down. This one went a slight bit over the zero line. Nothing is perfect, but this is nearly perfect.

Returning to the three drives pattern, I often will use the detrended smoothed adaptive CCI for confirmation. Notice on the leftmost three drive pattern that the CCI had a divergence pattern, but the lower subgraph, with the detrended CCI, shows a very clear higher level on each of the three drives. The bars turned positive long before the CCI. On the third drive I prefer to see the detrend stay in the green. In this case it went slightly negative, but was close enough to confirm the third drive. The three drive pattern on the right is a bit more perfect. The CCI formed more of a head and shoulders, but notice how the detrended CCI (bottom subgraph) had a very high level at point 1, much lower level at point 2, and had long been red and negative by point 3. The smoothed CCI did stay over the +100 level when this occurred, so I would have waited until the CCI returned to under the 100 line.

Here’s a first cross down, followed by a first cross up. The down signal didn’t produce much price movement. You never know the extent of the move that will follow a signal. Sometimes that gives you a clue that the next signal in the opposite direction will work out better. In this case it did.
Back to the detrend. Here are two examples of divergences with confirmation via the detrend. The sell divergence on the left side the detrend went just a hair to the positive before turning down, but was close enough. This isn’t an exact thing. You have to allow for a little room, as long as the concept is there. On right side example the detrend stayed in the green for the buy confirmation.

Here is a bear flag that broke to the downside. As a pure chart interpretation, just looking at the price bars, it might have been possible to see this in real time. It is always very clear after the chart is drawn, but while the pattern is developing it can be difficult to spot, especially if you are daytrading. The zero line reject made the pattern much easier to spot. The CCI only got about halfway to the zero line, but the reversal in momentum made this a valid trade. In the middle of the CCI was the three drive pattern I referred to earlier, where the divergence was between the first and third pivot, with the second pivot in between the two. Another reject occurred within this pattern, without much follow through in price. The three drive pattern was followed by a classic first pullback with a nice follow through in price.

The left side of the CCI shows a first pullback, then in the middle is another first pullback to the upside, followed by a zero line reject. The reject went a bit below the zero line, but the trend of prices was clearly up. Rejects after the first pullback can be a little less reliable. They become more and more unreliable the more they occur within the same trend. There are other indicators to watch as a clue as to when it is getting late in the game. One method is the use of standard error bands that I discuss in another article.
Here’s another three drives pattern, this time with another head and shoulders on the smoothed adaptive CCI, with a confirming CCI detrend with three higher bottoms. It was followed by another first pullback, which is no surprise as they will often follow the three drives pattern.
Here is an interesting pattern. The detrend CCI displays the head and shoulders formation with the right should break occuring right as the smoothed CCI is sitting on the extreme 200 line. I would only view this as a warning at this point. I don not go short if the smoothed CCI is still above the 100 line, and in this case it is at the 200 line showing extreme upside momentum, although overbought. When the smoothed CCI finally broke below the 100 line it was accompanyed by a reversal under the zero line by the detrended CCI. Price followed down shortly thereafter.
The examples and ideas presented here are not meant as a trading system. An indicator just indicates the possibility, but there is no assurance that any of these patterns will result in a successful trade. You must do your own research and tabulate your own stats to gain confidence in your trading. I have been purposely vague in giving exact formulas and parameters. That is an area of research you need to do on your own charts, on the markets you trade, and for your own, personal trading style. My parameters and stats won’t help your trading. It takes a lot of time and effort to put a trading plan together. I’m hoping just to encourage and inspire some ideas for your own research and testing.
-Doug Tucker